


This is part of a series of posts about Storage Field Day 9.
![]()
Storage Field Day 9 is just over a week away, so time to dig into some preparation posts!
First up is NetApp, which is a public company, so let’s dig into the financials and see what they can tell us about what’s going on at NetApp, shall we?
I’ve pulled public filing data back to 2009, and used the first three quarters of NetApp’s fiscal 2016 to make a simple estimate of the full year 2016 results. It’s a simple 4/3x of the sum of current quarter flows (revenue and cashflow) and a simple average for stocks (balance sheet). It’ll be wrong, but it will give us an idea of what the final results will probably look like. I’ve labelled all my predicted values as 2016F so it’s clear it’s not reported figures.
NetApp In One Chart

NetApp Revenue Growth (Source: SEC filings and eigenmagic analysis)
That’s basically the problem right there: revenues are decreasing. NetApp just isn’t selling as much stuff as they used to.
All the other machinations of the way finances work means the financial returns that NetApp is generating aren’t that flash.

NetApp Return on Assets (ROA) and Return on Equity (ROE) (Source: SEC filings and eigenmagic analysis)
The returns are volatile as well (NetApp has a beta value of 1.67), so investors expect a higher risk premium than other, more predictable stocks, and when you don’t manage to generate that sort of return, investors get grumpy, because they’d be better off putting their money elsewhere.
That’s a big reason why investors sold off NetApp stock between 2011 and 2012, when the price dropped from $52.11 (which in my mind was over-valued anyway) down to $34.87 at the end of NetApp’s fiscal 2012. It’s $26.00 at time of writing.
Common size income gives us a hint as to what’s happening inside the company’s operations:

NetApp Common Size Income Analysis (Source: SEC filings, eigenmagic analysis)
NetApp has been investing in R&D, and has recently been investing more in Sales and Marketing as well. Note the cost of goods sold jumped up in 2012. That’s due to the Enginio acquisition which became the E-Series line of products, which, according to SEC filings, have higher materials costs than existing NetApp product lines at the time. There was also a jump in headcount around the same time, resulting in layoffs a year later. More on that in a moment.
The cost jump is significant because of this:
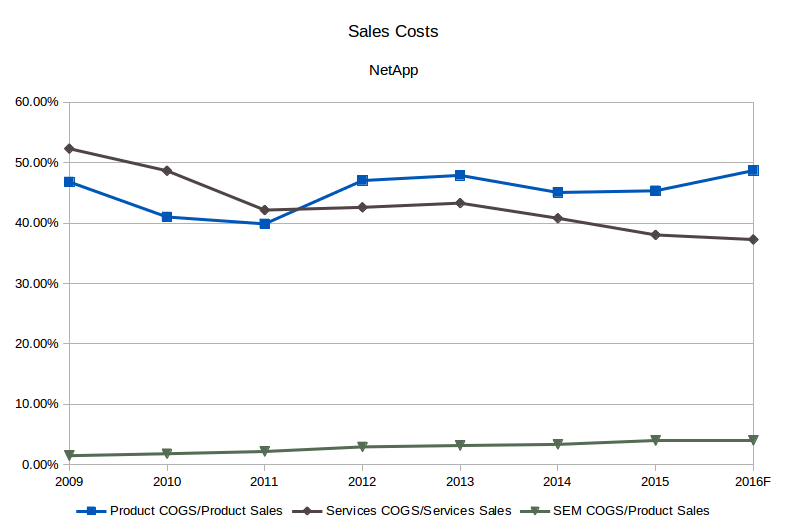
NetApp Cost Breakdown (Source: SEC filings, eigenmagic analysis)
Note how the cost of product jumped above the cost of services in 2012. SEM is Software Entitlements and Maintenance, ongoing software subscriptions and maintenance costs, basically. Services is mostly the cost of hardware maintenance (about 70-80%) and the rest is the cost of professional services and that sort of thing.
NetApp appears to be getting more efficient at delivering services, so maybe maintenance costs are getting lower due to gear being more reliable. The newer products have increased costs, which isn’t necessarily bad if the margins are there.
Where Did The Margin Go?
And here’s where things become really interesting:

NetApp Gros Margin, Operating Income and Net Income vs. Sales (Source: SEC filings, eigenmagic analysis)
Note that gross margins have pretty much recovered after the hit to costs from the more expensive E-series arrays. But profits are going the wrong way. What’s going on?
Well, two things. First, the products that NetApp has just aren’t selling as well as they used to, so it takes more effort to sell them, which results in increased Sales and Marketing costs, which eats into your gross margins. R&D costs have also increased as NetApp invests to try to build products that will appeal more to customers, things like all-flash FAS. These things take time to have an effect, if they work (*cough* FlashRay *cough*).
But there’s also been a lot of mucking around behind the scenes that you need to dig into the notes to the financial statements to tease out. At the same time as the Engenio acquisition, NetApp took on a lot of staff that they ended up not needing, and then had to take a charge for restructuring. There have been quite a few of these ‘restructuring’ charges over the past few years, which I interpret as chopping and changing because management weren’t sufficiently organised.
Basically, the previous CEO, Tom Georgens, didn’t seem to have a handle on what NetApp should be after Dan Warmenhoven stepped down. Management generally kind-of flailed about for a bit as the old guard who’d been with the company for decades changed over to new blood in George Kurian and friends, which was only nine or so months ago. It’ll take time for whatever he tries to take effect.
While that was going on, people were trying to make decisions about what to do without a coherent overall plan, and that meant hiring the wrong people, or too many, only to have to get rid of them a year later.
Dividends!
One other important thing to note. NetApp started paying a dividend in 2014. They started doing stock buybacks in 2012, which they continue to do, and 2016 is looking like the biggest year of buybacks and dividends since 2009.
Tech companies don’t like giving cash back to shareholders, which doesn’t really matter so long as the stock price keeps going up (ignoring taxes, but let’s not get into that). NetApp’s stock isn’t, and my Altman analysis shows a pressure for a cash surplus due to NetApp’s lack of revenue growth, so NetApp is doing a good thing giving excess cash back to investors so they can go get better returns somewhere else.
I’m honestly a bit confused by NetApp starting to pay dividends, because usually that indicates that a stock isn’t a pure capital growth stock. Some of the money is re-invested, sure, but a regular dividend is something low-risk investors (like retirees) like to have, and NetApp is higher risk than that due to its volatility. Institutional investors also don’t like the dividend amount moving around all over the place; they want nice, regular cashflows. Turning on the dividend tap commits NetApp to a regular payout every year, lest people speculate about NetApp being unable to provide dividends any more (suggesting cashflow issues) which places an additional financing burden on the company to ensure the cash is there to distribute. You generally don’t start issuing dividends unless you plan to continue issuing them indefinitely, and at about the same rate.
As an aside, NetApp is the first company I’ve looked at for Tech Field Day prep where the Altman analysis puts them in the Zone of Ignorance.
Disclosure
I have done work for NetApp in the past, and probably will in the future. I’ve done consulting for clients who have used NetApp gear, and I’ve written whitepapers and marketing collateral for them. NetApp invited me to their Insight convention a couple of years ago and paid for my flights, accommodation, entertainment, etc., as is usual for analysts.
I do not own any NetApp stock directly, and I’m not aware of the specific stocks in whatever makes up my managed portfolio.
I do my best to undertake an impartial analysis, but feel free to accuse me of bias if you believe you see some. I hope I can convince people on the strength of my arguments alone, but I’m aware that companies attempt to influence me all the time, and some of it is bound to work at least some of the time.
Pingback: Architecting IT | Storage Field Day 9 Preview: NetApp
Nice insights! Interesting to know where they go next…