


Here we are, back again with predictions for another year.
This Year’s Process
Instagram changed their API thing so my app was locked in a sandbox and couldn’t see the outside world. That was a drag. I didn’t have time to navigate the approvals process, because I only started looking at this on Monday 23 Jan after voting had closed.
However, the Selenium web browser automation framework proved handy for grabbing images instead. I lost all the metadata for the date range, but stopping it when it started finding images obviously from last year meant I got a pretty good dataset. I was only looking at the #hottest100 hashtag, so that limited the amount of raw vote data I grabbed, but I ended up with 5,096 images in total. Assuming most of those were vote ballots (a quick eyeball of the images indicated they were), that was a decent sample.
I grabbed some Twitter data as well, also from the #hottest100 hashtag, but looking at the URLs of the attached media most of the vote data was actually cross-posted from Instagram. I didn’t bother collecting those images, because that would have double-counted the votes. Like last year, it seems that Hottest 100 voters are Instagram users, not Twitter users. There’s another demographic data-point for you, marketers.
I grabbed the songlist from the TripleJ website using basically the same process as last year: manually save the HTML and process it with a script. The same script as last year, in fact, because the website TripleJ are using appears to be basically the same underlying structure as last year.
Counting The Votes
As discussed in my last post, I made some significant changes to my vote counting script to improve the matching this year. TripleJ have also made changes to the way your vote ballot is displayed that actually helped me substantially.
This year, each song on a ballot is Title – Artist, all on one line. Each line in centered on the page, but we don’t have two different columns like last year. This makes the OCR process I’m using work much better.
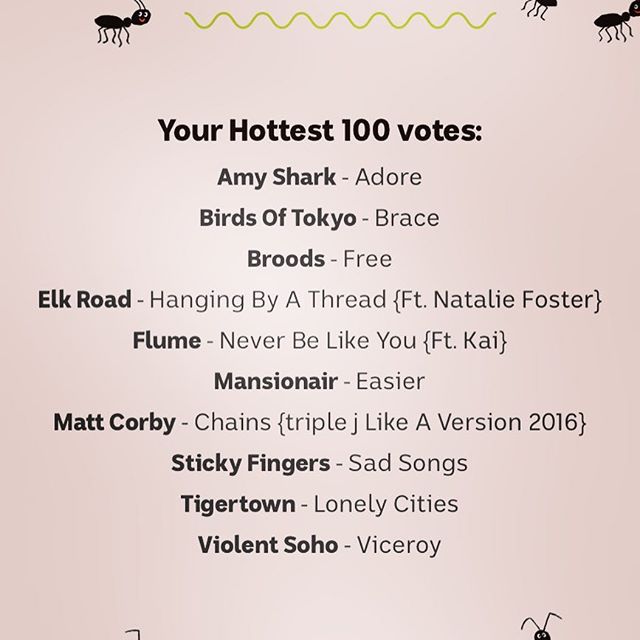
After this image is OCR’d, we get this kind of data:
Your Hottest 100 votes

Amy Shark K Adore

Birds OfTokyo r Brace

Broods 7 Free
Elk Road - Hanging By A Thread {Ft Natalie Foster}
Flume e Never Be Like You {FL Kai}
Mansionair v Easier
Matt Corby - Chains {triplej Like A Version 2016}
Sticky Fingers - Sad Songs
Tigertown - LoneLy Cities
Violent Soho r Viceroy
Still a bit messy, but both the artist and song are on the same line. Some really long song names wrap to the next line, but they’re fairly rare based on my quick eyeballing of the images. And, if I strip off all the {Ft. people} or {triple J Like a Version} stuff at the end, then I’m even more likely to be able to find a match.
I tweaked the OCR process this year to use a restricted character set so the output would be less messy, and that appears to have helped as well.
We end up with 84,348 lines of data to process. Lots of those lines and blank or header information like “Your Hottest 100 Votes”. Last year there were 99,951 lines of data, so we have a pretty similar sized dataset.
Data Matching
The key I used for matching for 2016 is this format: %(artist)s - %(song_title)s with all the {Ft. etc.} stuff stripped off. I added an option to match with the full song title including the extra stuff to see if there’s a difference in the final outcome. More on that later.
This time around, a lot of the lines match exactly, so the OCR data is much cleaner than it has been in previous years. My vote counting script treats that as a special case and doesn’t do any more computationally intensive fuzzy matching if it doesn’t need to.
If there isn’t an exact match, the fuzzy matching kicks in for lines with more than n characters, because short lines tend to be just noise. This time around n is chosen based on the shortest matching key from the songlist (again, stripping off the {Ft. etc.} stuff by default.
For the actual fuzzy matching, I use an improved algorithm over last year, because it previously had a bug that I only just found. I use the same Levenshtein distance method to detect a potential match, but rather than just taking the first close match it finds, the script adds each possible match to a candidate list. Then it selects the best match. Previously the script would match the first song by a particular artist because it happened to just make it over the threshold, even though there was actually a better match to be found.
This year the script also calculates a Sørensen–Dice index for the best candidate match, and if it or the Levenshtein distance are above a certain threshold (a higher one than the candidate threshold) then it’s counted as close enough to be a match. I did some manual verification of the matching to tune the threshold parameters to minimise both false-positives (matching songs that aren’t a match) and false negatives (not matching songs that should match) and seem to get the best results with a candidate threshold of 0.72 and a hurdle threshold of 0.75.
I also did a couple of other runs using different threshold values: Relaxed(0.65, 0.7) and Strict(0.75, 0.8) to see what difference there might be. There’s little change between the Relaxed and the Strict models for the top 30 songs or so, but differences get magnified as there are fewer votes required to change the rank of a song, which is to be expected.
It takes the script 1 minute and 45 seconds to tally all the votes using 4 CPU cores on an Intel i7.
The Predictions!
Once again I’ve put my predictions into a Google Sheet so you can follow along on the day as the official results come in. I’ve put all three models in this time, so it’ll be fun to see how it all pans out.
I’ll be having a BBQ on the day, so there will likely be some delays to my updates to the sheet while I’m off enjoying the predicted nice weather and a day off.
Other Estimates
I see Nick Whyte has also done a sample and predictions thing again this year. Happily, it looks like our results are pretty similar, and that’s at least partly due to using the same primary data source. Still, it’s nice to have independent verification of your results.
Nick has used more hashtags than I did, so he has more data. I’d expect his predictions will be more accurate in the lower-order rankings, because there are fewer votes to be counted there.