


Welcome to the first instalment of my now-traditional pre-Tech Field Day event prep work! First up is EMC.
I’ve picked EMC first for two reasons: firstly, they’re one of only two publicly listed companies we’ll be talking to as part of SFD5, and secondly, because they’re huge and have many products, and I might want to circle back to them later on. There’s a lot I could dig into.
EMC and the GFC, an Adventure in Financial Statement Analysis
As you know, I love me some DuPont analysis, so let’s look at 10 years of financial statements from EMC. Fun fun!
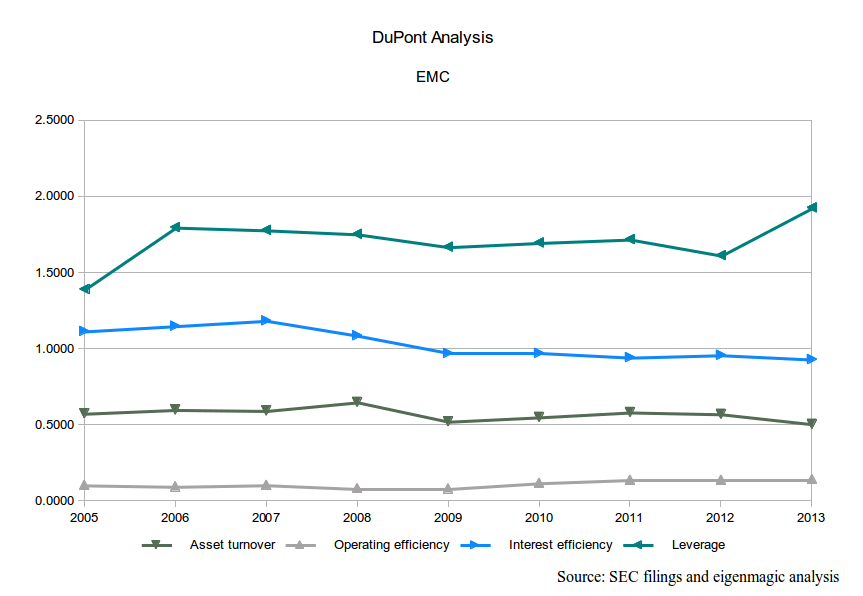 The first thing we notice from the DuPont breakdown chart is how incredibly boring it looks. The lines are all pretty flat, and they’re not in terrible ranges. Leverage is under 2. Asset turnover is about 0.60. Yawn.
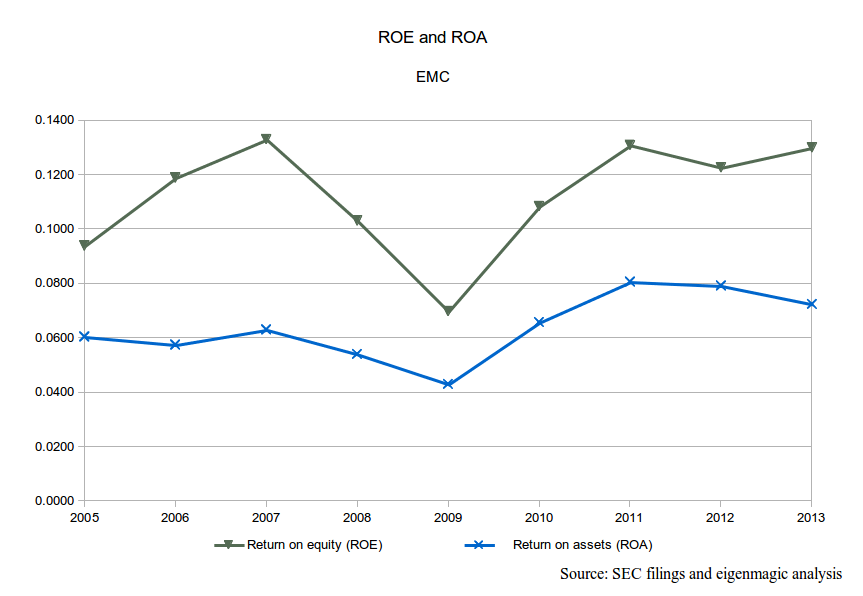 If we look at Return on Equity and Return on Assets, we get a very different story. See that big V shaped dip? That was the Global Financial Crisis. Note how EMC have recovered their ROE back to where they were before the GFC? And in 4 short years? Nice.
Look closer: ROA was above pre-GFC levels in 2010, and has stayed there. The slight drop at the end is probably because leverage increased, so EMC borrowed to buy some assets, thus ROE has gone up even though ROA declined. I’d expect ROA to go up again next year, as the investment starts to pay off.
Let’s drill into this in a bit more detail, because there’s an important story here for non-financial types. I’d like you to understand a bit more about how EMC did this, and to demonstrate how much you can learn about a company from some pretty basic financial statement analysis.
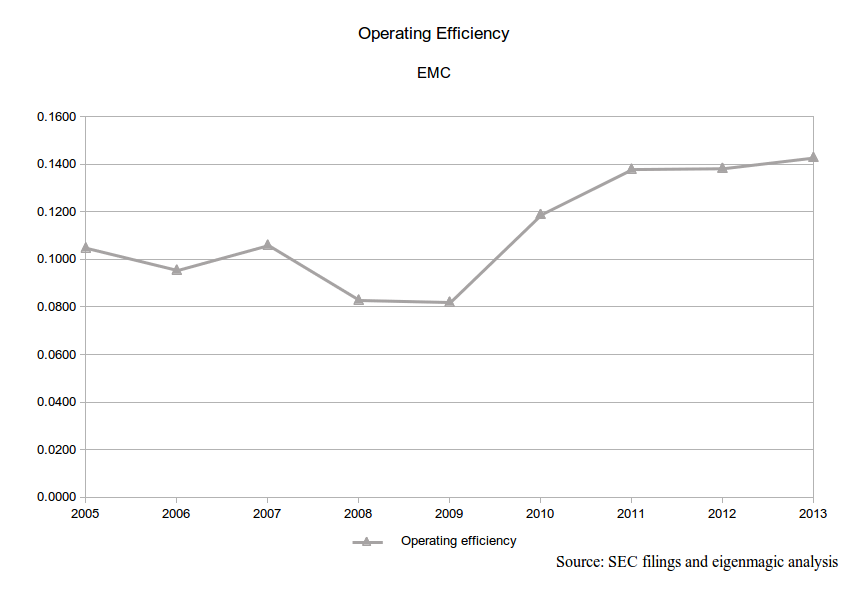 This is a chart of just EMC’s operating efficiency. You can see it decreased and was flat until 2009, and then ramped up to over 0.14. That’s about 40% higher than it was before the GFC.
Operating efficiency is Revenue divided by Net Operating Profits After Tax (NOPAT), which is basically how good you are at hanging on to the money customers pay you. If you have high costs, you need high prices (or massive sales volumes) in order to have high operating efficiency. High costs without high prices means crappy operating efficiency.
But prices are ‘sticky’; generally, if you increase the price, you sell less stuff, and in a downturn, people buy less anyway (your prices feel ‘higher’ than they used to in a downturn). Instead, if fewer people are buying your stuff (making Revenue go down) you have to cut costs to keep your profits up. That’s pretty much what we see here, although it’s a little more complicated, since total Revenue only went down in one year: 2009. To find out more about what happened, let’s use another of my favourite techniques: Common Size Income analysis.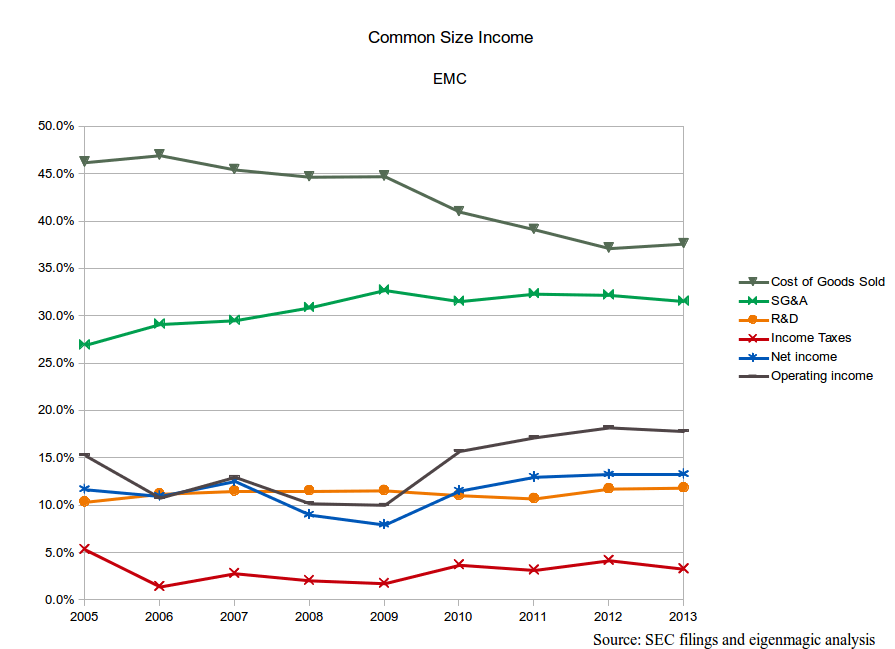
With this technique, you calculate everything as a percentage of the Revenue for that year. This lets us compare different years as if they were the same level of Revenue, so we can see how much it costs for us to get (and keep) each dollar of sales, and compare different years (or companies!) to one another. It turns apples and oranges into apples and apples. How you hang on to each dollar of sales is directly related to our operating efficiency, which is just one of the reasons I like this technique.
Aha! Now we can see what happened. Before the GFC, Selling, General and Admin costs (SG&A) were trending upwards, but since 2009, they’ve stayed at about 32% of Revenue. Gross revenues went up from 2007 onwards, so by keeping selling SG&A fixed, profits increased, because it took the same amount of effort to sell more stuff. But that’s not all.
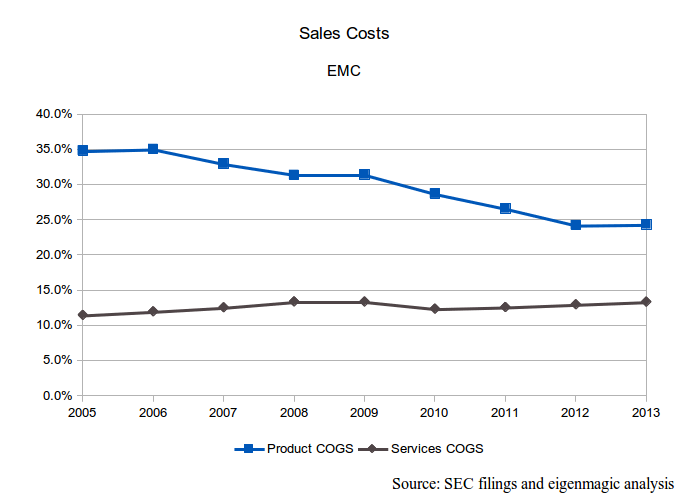
We can also see that Cost of Goods Sold has come down. These are the costs that are directly attributable to a particular bit of kit (or service) being sold, unlike SG&A which is the more general overheads like admin, company wide marketing, branding, etc. COGS was steady, slightly trending down maybe, until the GFC hit. A focus on variable cost reduction has worked, with COGS dropping from 47% of Sales before the GFC to about 37% now. That’s a substantial drop, 10% of revenues overall, and 21% from baseline over 6 years.
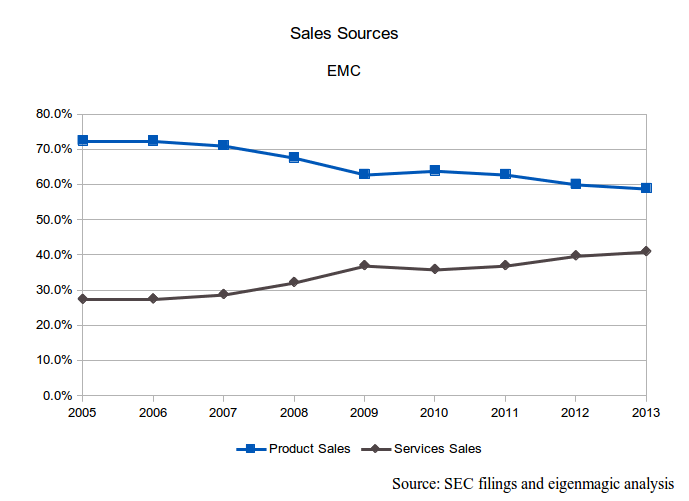
If we look at the breakdown of product and services COGS, we can see where the savings came from: product COGS. Services COGS have slightly increased as a proportion of revenue, but product COGS have steadily fallen. That’s efficiency for you. You can see that services have much lower costs than product as well, and when you combine that with our next chart, the proportion of sales for product and services, we can see that selling more services, which have lower COGS, makes us more profitable!
This is just solid management of a large company. It demonstrates that the people in charge of EMC know how to pull the various levers of business, and that they are pretty darn responsive when they need to be.
Which brings us full circle.
The financials look a lot like a well-run, large blue-chip company that basically tracks the index; their beta value (a measure of volatility relative to an index, in this case the NASDAQ) is about 1.09. EMC’s weighted average cost of capital (WACC) is somewhere around 8.22%, so with ROE of 13%, a shareholder stands to make decent money from EMC, but it’s not what I’d call a high-growth stock.
Also interesting is that EMC paid a dividend in 2013, of 30 cents a share. Growth stocks don’t pay a dividend, because they reinvest all the profits to grow the business, and grow the stock price instead. Returning cash to shareholders means (in theory) that you think they’ll be able to get a better return by investing that cash elsewhere, rather than letting you play with it. It’s a mature decision, and one a lot of companies should be making, but don’t because their managers are hubristic cretins.
I hope that it signals two things: that EMC is run by mature adults, and that they are so focussed on some tremendous opportunities that are fully funded that they don’t need any extra cash to fund them, and so, wisely, remove the distraction of too much money. A bunch of excess cash sloshing around would just provide temptations to let SG&A and COGS slide back up, but without a corresponding increase in Sales. Investing the right amount of cash in the right opportunities is what the game is all about.Hopefully this provides some context for the suite of products and services that EMC offers. I’ll delve more into them, and how they fit into the financial picture, in a future post.
Pingback: SFD5 Prep Work: EMC
Pingback: SFD5 Prep Work: Sandisk | eigenmagic